
Average order value (AOV) is the average amount a customer spends per order, calculated by dividing revenue by the number of orders in the same period. The trouble starts when you check it: Shopify, your spreadsheet and your payment report each count “revenue” differently, so one month of orders can give you several AOVs.
I read Shopify’s own definition, worked one store’s month four ways and built an AOV calculator for your own numbers.
Key Takeaways
- AOV = revenue ÷ number of orders for the same date range.
- Shopify’s AOV is gross sales minus discounts, divided by orders. It counts canceled and unpaid orders and ignores returns.
- One month of orders can produce AOVs 31% apart, depending on what you count as revenue. Pick one version per job and don’t mix them.
- Check the median order before you set a free-shipping threshold, because one large order can inflate the average.
What Is Average Order Value (AOV)?
Average order value measures what a typical checkout is worth, separately from how many checkouts you get. Revenue is orders × AOV, so AOV is the half of the equation you can grow without buying more traffic. It’s an average per order, not per customer: someone who orders 3 times counts 3 times.
Say your store took 200 orders last month at a $65 AOV, which is $13,000. The same 200 orders at a $75 AOV bring in $15,000, about 15% more, with zero extra visitors. It’s also the first metric in Zipify’s 5-minute weekly KPI check for Shopify stores.
How Do You Calculate Average Order Value?
To calculate average order value, divide revenue by the number of orders for the same date range. The only real decision is what counts as revenue, and you make it before you divide.
AOV = revenue ÷ number of orders
- Pick a date range. A full month smooths out weekend and payday swings.
- Decide what “revenue” means and write it down: products only, or products plus shipping and tax.
- Count orders in the same range, with the same rule for canceled and test orders.
- Divide revenue by orders.
With the numbers above, $13,000 ÷ 200 orders = a $65 AOV. Step 2 is where most hand calculations go wrong.
How Does Shopify Calculate AOV?
Shopify calculates AOV as gross sales minus discounts, divided by the number of orders. According to the Shopify Help Center’s sales reports guide, it reflects only product revenue at the moment an order is placed.
The detail most guides miss is in Shopify’s definition of gross sales, which includes pending, canceled and unpaid orders. Shopify changed its AOV definition in January 2023, which is why older screenshots and guides show different numbers.
- Counted product price × quantity, minus discounts, including pending, canceled and unpaid orders
- Not counted shipping, taxes, returns, exchanges and edits after the order, test and deleted orders
So it isn’t net sales, as some app blogs claim: returns are ignored, not subtracted. To see your number, go to Analytics → Reports and open Average order value over time.
Shopify’s AOV counts canceled and unpaid orders and ignores returns, so it can run higher than the order value you actually keep.
Why Doesn’t My AOV Match Shopify’s?
Your AOV doesn’t match Shopify’s because you’re dividing a different revenue number. “Total sales” adds shipping and taxes back in, refunds take money out and Shopify keeps canceled orders in.
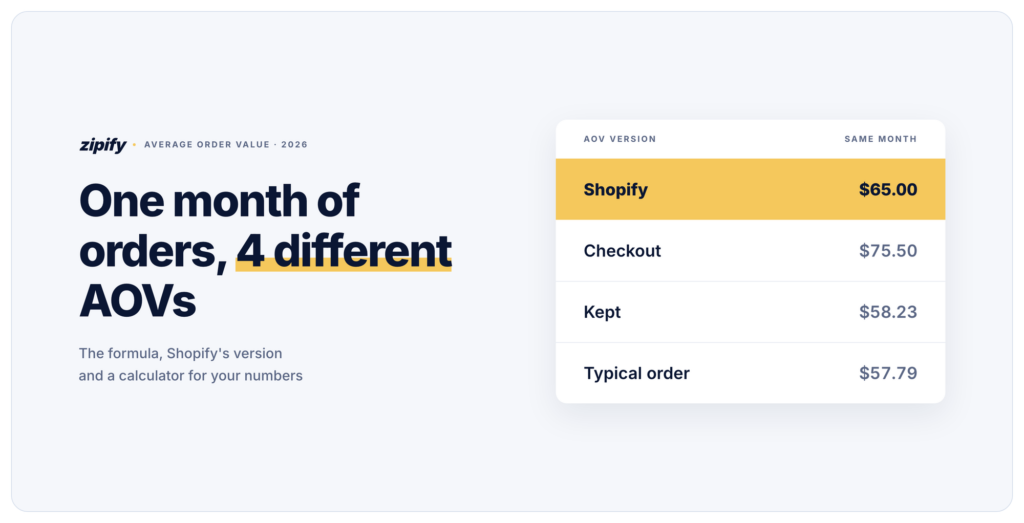
Here’s one hypothetical store’s October, worked four ways: 200 orders, $14,000 in gross sales, $1,000 in discounts, $1,200 in shipping charged, $900 in taxes, $1,300 refunded for returns, 8 canceled orders worth $520 after discounts and one $1,500 wholesale order.
Scroll sideways for more →
| Version | What you divide | Math | AOV | Use it for |
|---|---|---|---|---|
| Shopify dashboard AOV | Gross sales − discounts, all orders | $14,000 − $1,000 = $13,000, ÷ 200 orders | $65.00 | Tracking the trend in Shopify reports |
| Checkout AOV | Gross sales − discounts + shipping + taxes | $13,000 + $1,200 + $900 = $15,100, ÷ 200 orders | $75.50 | Matching payment reports |
| Kept AOV | Without canceled orders and returns | $13,000 − $520 − $1,300 = $11,180, ÷ 192 orders | $58.23 | Profit math and what you can pay to get an order |
| Typical-order AOV | Without the $1,500 wholesale order | $13,000 − $1,500 = $11,500, ÷ 199 orders | $57.79 | Setting a free-shipping threshold or offer price |
Hypothetical store, one month: 200 orders, $14,000 gross sales, $1,000 discounts, $1,200 shipping, $900 taxes, $1,300 returns, 8 canceled orders ($520), one $1,500 wholesale order. Shopify’s AOV definition: Shopify Help Center, checked November 8, 2026.
$57.79 to $75.50 is a 31% spread from the same 200 orders. None of the four is wrong. Mixing them is: compare this month’s checkout AOV with last month’s dashboard AOV and you’ll “find” a 16% lift that never happened.
Redo it with your own numbers in the AOV calculator below. It starts with the example store.
AOV calculator: four ways to count one month
Prefilled with the example store above. Replace the numbers with yours.
Shopify dashboard AOV (required)
The other three versions (optional)
Enter your numbers to compare.
The skew check: when the average hides the typical order
An average gets dragged around by outliers. Take 10 orders: nine at $50 and one at $1,500. The AOV is $195, but the median (the middle order) is $50, and no customer spent anything close to $195.
As DataCamp’s guide to mean vs. median (2026) explains, extreme values don’t pull the median, so it better reflects a typical order. If your AOV sits well above your median, export your orders (Orders → Export), sort by total and check the biggest ones before pricing anything on the average.
What Is a Good Average Order Value?
A good average order value is one that’s rising for your store while conversion rate and margin hold. Benchmarks give you a range, not a target, because category and price point drive AOV more than anything you change on the site.
According to IRP Commerce’s market data, UK and Irish online stores averaged £133.12 per order in September 2026, up 4.56% on a year earlier. Within that, Kitchen & Home Appliances averaged £57.74 and Baby & Child £871.49, a gap of about 15 times. Compare yourself with last quarter, not with someone else’s category.
And watch what a higher AOV costs. Take 1,000 visitors converting at 3% with a $65 AOV: that’s $1,950. Push AOV to $72 with an offer that drops conversion to 2.6%, and revenue falls to $1,872. AOV went up 11% and revenue went down 4%.
What Should You Do Once You Know Your AOV?
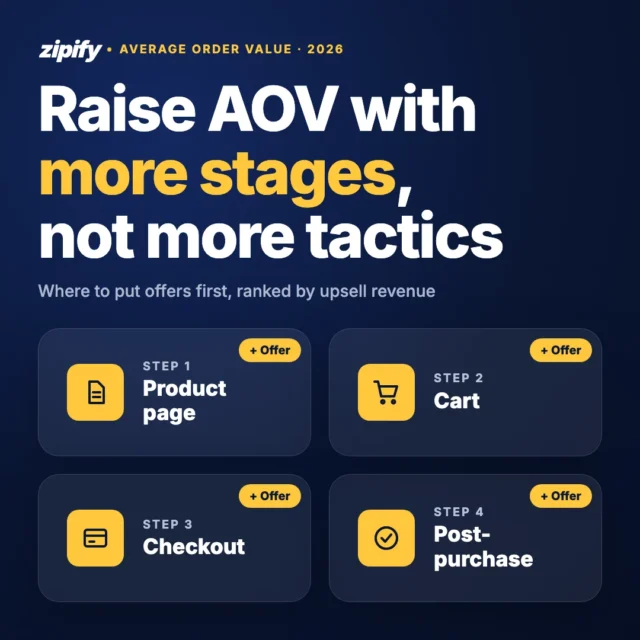
Set your free-shipping threshold from your typical-order AOV, not the dashboard number, then test offers that add to the basket at each step: the product page, the cart and after checkout.
With the example store, a threshold a little above the $57.79 typical order (say $65) puts most shoppers one add-on away from free shipping. I cover which offer works at each stage in how to raise average order value on Shopify, stage by stage.
Gussy’s Gut, a pet wellness brand, raised AOV 16.47% in its first 30 days after adding the Slide Cart Drawer in OneClickUpsell (OCU), which puts upsell offers inside the slide-out cart.
Frequently Asked Questions
What’s the difference between AOV and revenue per visitor?
AOV is revenue divided by orders, so it only looks at people who bought. Revenue per visitor (RPV) is revenue divided by sessions, so it combines AOV and conversion rate in one number. Use RPV to judge any offer that might make baskets bigger but buyers fewer.
How often should I check my average order value?
Check your average order value monthly to follow the trend, and weekly while you’re testing a new offer or threshold. Skip weeks with a sale when you compare, since one promotion can swing AOV more than the change you’re testing.
Can I calculate AOV by channel, product or customer type?
Yes. Export your orders from Shopify (Orders → Export), filter the file by channel, product or new versus returning customers, then divide that segment’s revenue by its order count. Use the same revenue definition for every segment, or the comparison won’t hold up.
The Bottom Line on Average Order Value
Average order value is simple division, but the number you get depends on what you divide. Pick one version for each job, keep it consistent and check the median before you act on the average. Once you know your real number, offers at the product page, cart and after checkout, the kind OCU runs, are the most direct way to raise it.