
Most upsell benchmarks are copied from one vendor’s blog to the next, and the post-purchase acceptance rates that circulate range from 3% to 25%, with nothing behind them a store owner can check.
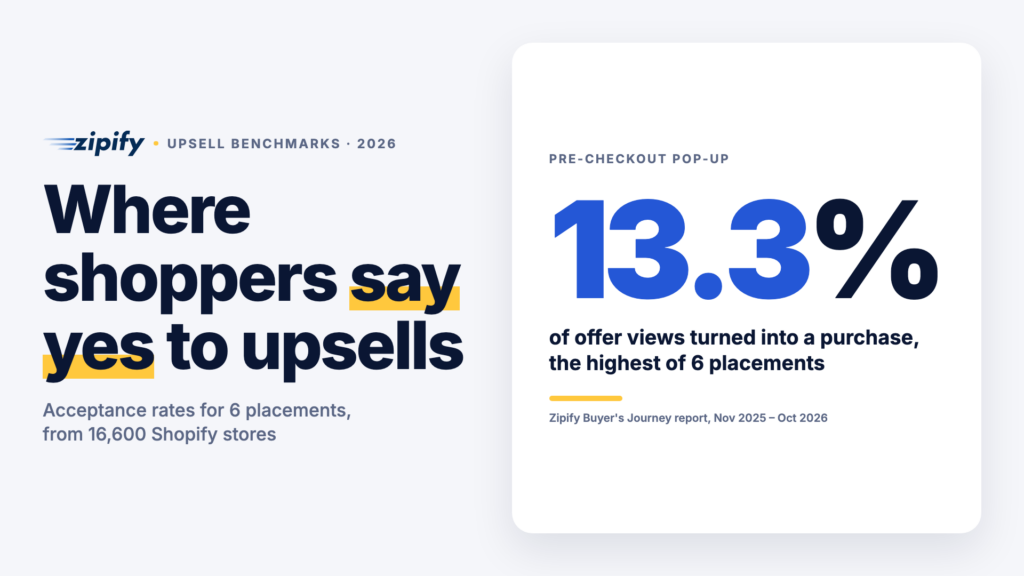
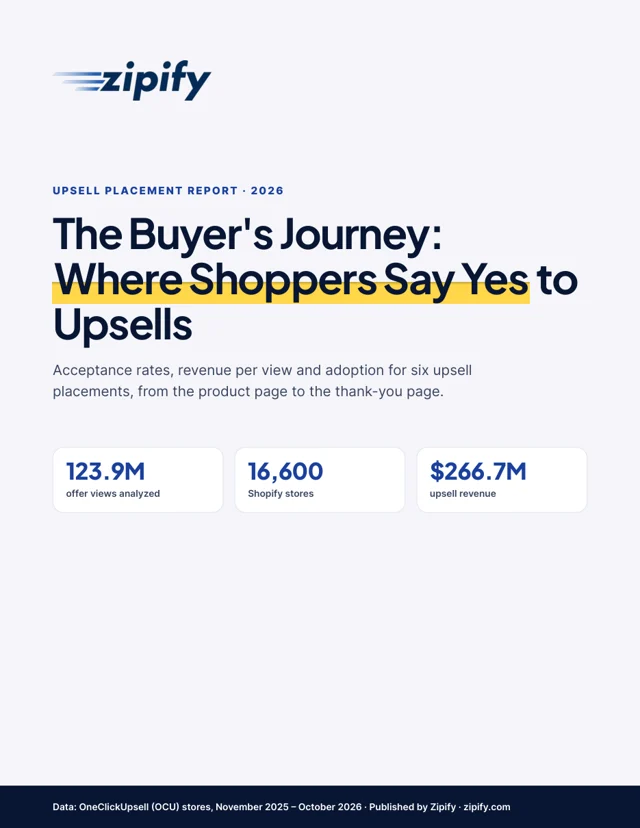
Across 16,600 Shopify stores, 7.9% of upsell offer views turned into a purchase over 12 months, but the rate ran from 2.4% on the thank-you page to 13.3% in a pre-checkout pop-up. The figures come from Zipify’s Buyer’s Journey report, which splits 123.9 million OneClickUpsell (OCU) offer views from November 2025 to October 2026 by where each offer appeared. Below, I pull out the key numbers. The full 8-page report is free to download further down this page.
Upsell Acceptance Rate and Revenue by Placement
Acceptance rate is offers bought divided by offer views. Revenue per 1,000 views adds the price of the offer, so it shows what a placement actually earns.
Scroll sideways for more →
| Placement | Acceptance rate | Median store | Revenue per 1,000 views | Stores running it |
|---|---|---|---|---|
| Product page | 4.0% | 2.5% | $1,041 | 1,029 |
| Cart drawer | 8.8% | 6.4% | $1,827 | 2,433 |
| Pre-checkout pop-up | 13.3% | 10.2% | $3,103 | 6,985 |
| In-checkout | 4.2% | 2.5% | $705 | 678 |
| Post-purchase | 8.7% | 7.4% | $2,954 | 13,614 |
| Thank-you page | 2.4% | 1.5% | $466 | 3,470 |
Source: Zipify Buyer’s Journey report, OCU data from November 2025 to October 2026. Median store counts stores with 1,000+ views in that placement. Highest value in each column in blue.
Shoppers said yes most often right after making a decision: once a product was in the cart, and right after paying. Offers shown while they were still choosing, or after the order was confirmed, were accepted least. The median store follows the same order, so a few big brands aren’t driving the ranking.
Post-purchase brought in the most money, $150.1M of $266.7M, because nearly every store runs it and its offers are the most expensive. The pre-checkout pop-up earned slightly more per view, yet only about half as many stores used it. For a store that runs post-purchase offers only, that’s the next placement to test.
Price matters inside a placement too. In Cheech & Chong’s quantity test, the 3-bag offer converted at 10.19% against 14.48% for 1 bag, yet revenue per visit rose from $2.52 to $4.56.
Two more patterns stood out:
- Mobile shoppers accepted more offers in all six placements, from 1.07× desktop post-purchase to 1.53× in the cart drawer. Most orders now happen on a phone: Metorik’s analysis of 65M+ orders found 72% of WooCommerce orders in 2025 were placed on mobile.
- In-checkout offers ran on the fewest stores. Shopify’s Checkout Blocks documentation says placement on checkout pages requires Shopify Plus.
Download the Full Upsell Placement Report
Enter your email in the form below and the download button appears right away. Inside the report:
- Bottom-quarter, median and top-quarter benchmarks per placement, with a column for your own numbers
- A playbook for each of the six placements, with Zipify case studies
- A BFCM 2025 snapshot: $8.23M in upsell revenue at a 7.1% acceptance rate
- The full methodology and its limits
Get the full Buyer’s Journey report
Enter your email and the download button appears right here.
Thanks! Your report is ready.
How to Benchmark Your Own Upsells
Take at least 30 days of data, and only placements with 1,000+ views. Divide offers bought by offer views for the acceptance rate, and upsell revenue by views × 1,000 for revenue per 1,000 views. Then compare both with the median store above.
Below the median? Test the offer before you move it: product fit, price relative to the cart, and the headline. Zipify’s guide to why Shopify upsells underperform walks through those checks. Well above it? Try a higher-priced offer or a bundle, since a lower acceptance rate can still earn more per view.
Frequently Asked Questions
What is a good upsell acceptance rate?
It depends on the placement. The median store with 1,000+ views reached 10.2% with a pre-checkout pop-up, 7.4% post-purchase and 6.4% in the cart drawer. Top-quarter stores reached 17.5% before checkout and 11.8% post-purchase.
Which upsell placement converts best?
The pre-checkout pop-up, shown after add-to-cart and before checkout. 13.3% of its views turned into a purchase, 53% more than post-purchase at 8.7%.
What data are these benchmarks based on?
Offer views, purchases and revenue recorded by OneClickUpsell for every store that showed at least one offer between 1 November 2025 and 31 October 2026: 123,876,374 views and 9,770,999 purchased offers across 16,600 stores, excluding demo stores.